

The Dell PowerEdge R260 delivers a robust solution for small to medium-sized businesses in a compact, “pizza box” sized form factor.
Dell has recently expanded its server lineup with two new models, the PowerEdge R260 and PowerEdge T160. Both are tailored for edge computing scenarios, such as retail environments and small offices; however, the PowerEdge R260 features a short-depth rack design, while the PowerEdge T160 is a sleek, compact tower server–perfect for standalone use. Both models are equipped with a single Intel Xeon E-2400 processor, offering a balance of capability and cost-effectiveness.
Both models are powered by the Intel Xeon E2400 series and support up to 128GB DDR5 memory, iDRAC9, and various power supply and storage configurations. Besides their form factor, the main difference between the two servers are their storage options.
View this post on Instagram
Dell PowerEdge R260 vs R250
A direct successor to the PowerEdge R250, the R260 is designed to meet the growing demands of small businesses and remote offices by offering powerful, dense configurations in a compact form factor. The Dell PowerEdge R260 and R250 are 1U rack servers designed for small to medium-sized businesses, but they have several key differences.
One of the more noticeable differences is their size. While both servers share the same height and width (1.68 inches x 18.97 inches), the R260 is significantly shorter in depth, measuring 17 inches compared to the R250’s 23.06 inches, making it approximately the size of a pizza box, thankfully without the cheese oil stains. This difference in depth can significantly affect server space, as the R260’s more compact design allows for greater flexibility in tighter rack environments, potentially enabling more efficient use of available server space in data centers.
Despite being smaller, the R260 offers more flexible storage options, which enhances its appeal for businesses needing efficient and space-saving solutions. The R260 can accommodate up to 2 x 3.5’’ SATA HDDs and up to 6 x 2.5’’ SATA/SAS HDD/SSD drives, including a hot plug BOSS-N1 at the back for boot optimization. In contrast, the R250 supports up to 4 x 3.5’’ or 2.5’’ SATA/SAS HDD/SSD drives with the less advanced (non-hot-swappable) BOSS-S1 option.
The R260 is powered by the newer Intel Xeon E-2400 series processors, offering improved performance over the R250’s Intel Xeon E-2300 series. This upgrade in processing power allows the R260 to handle more demanding tasks with greater efficiency. Additionally, the R260 supports DDR5 memory with speeds up to 4400 MT/s, whereas the R250 uses DDR4 memory with speeds up to 3200 MT/s.
Dell PowerEdge R260 Specifications
| Features | PowerEdge R260 |
| CPU |
|
| Memory |
|
| Storage (Chassis options) |
|
| PCIe slots | 2 x PCIe Gen 4 slots |
| Storage Controller |
|
| Network | 2 x 1GbE LOM |
| Bezel | Security Bezel and Filter Bezel |
| GPU | Not supported. |
| Integrated Ports |
|
| System Management | iDRAC9 with Lifecycle Controller; Express, Enterprise, Datacenter, and OME Advanced Features |
| Power Supplies | 450W cable Platinum, 700W Titanium |
| Dimensions | H x W x D: 42.8mm (1.68 in) x 482mm (18.97 in) x 431 mm (17 in) |
| Form Factor | 1U Rack |
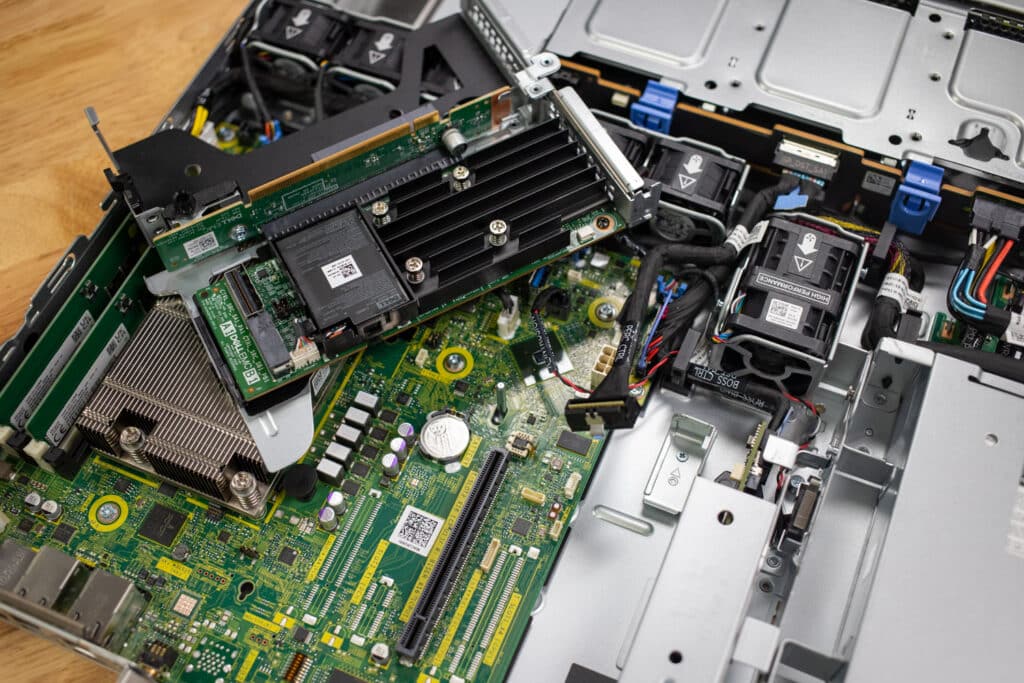
Dell PowerEdge R260 Build
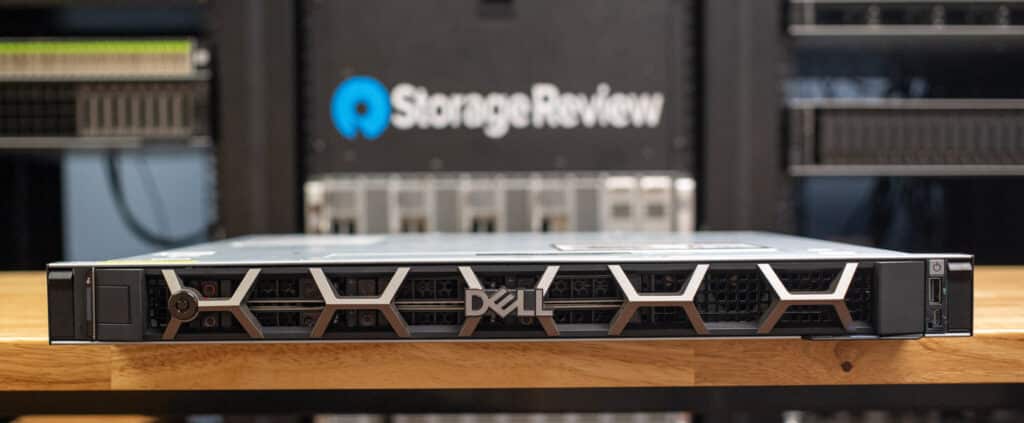
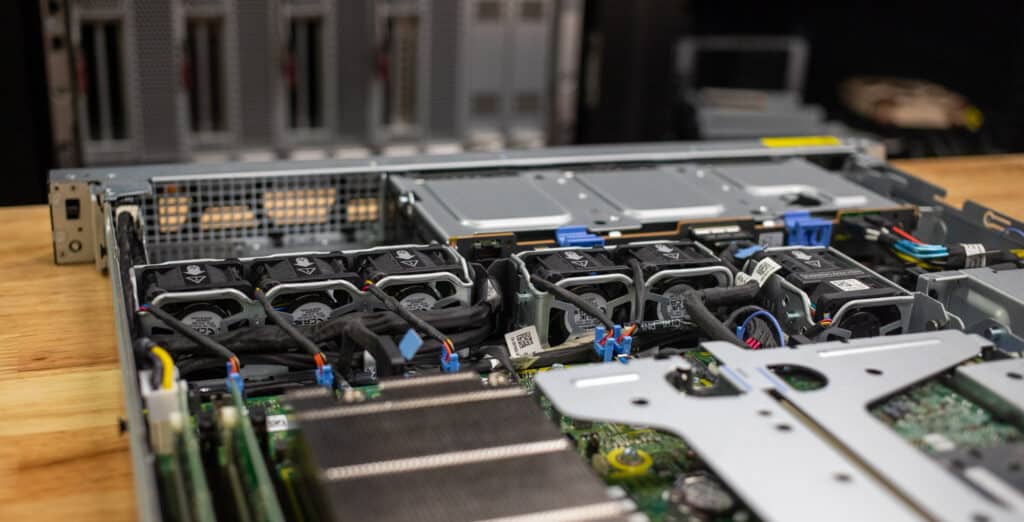
Let’s delve more into the design of the Dell PowerEdge R260. One standout feature is the filter bezel, an optional but significant accessory that covers the front of the server. This component provides essential protection against dust accumulation on internal components, helping to maintain proper airflow through the server. Such airflow management is crucial for ensuring optimal long-term performance. Without a filter bezel, dust buildup can cause components to overheat or necessitate higher fan speeds, leading to increased energy consumption. Our review unit has the standard bezel.
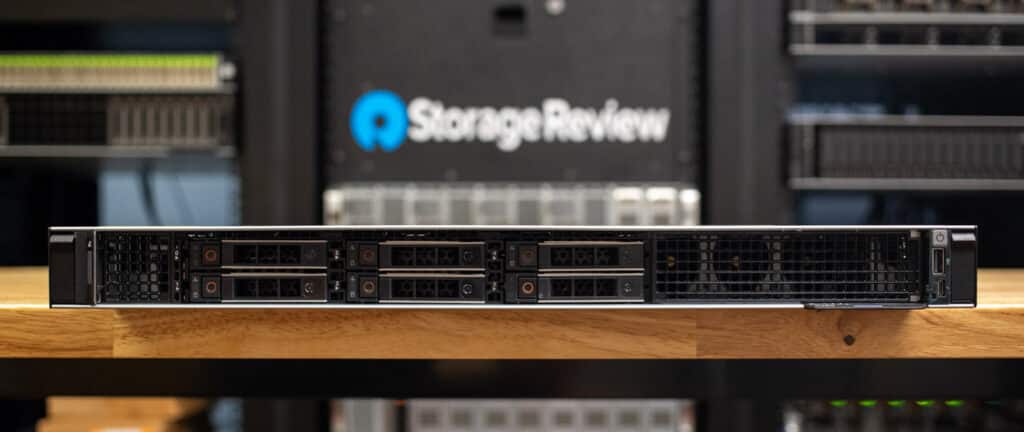
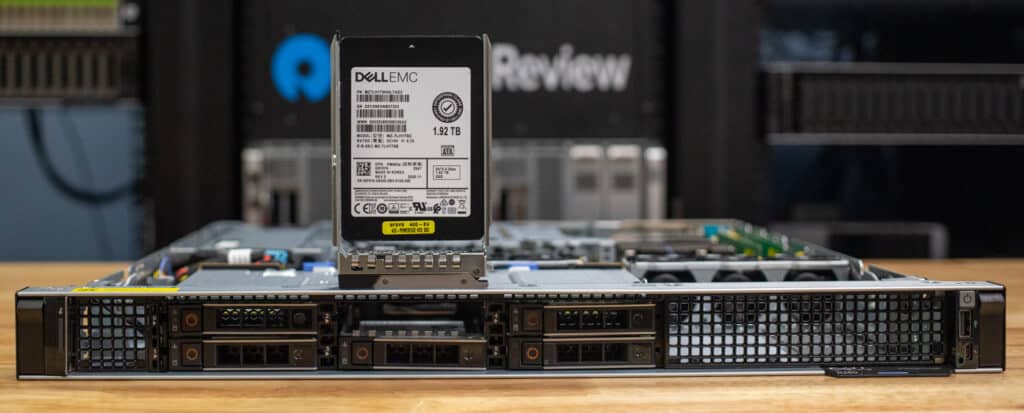
Looking at the front panel, we see the flexible storage options. As we indicated in our comparison with its predecessor, it can accommodate up to 2 x 3.5” SATA/SAS HDD/SSD and up to 6 x 2.5” SATA/SAS HDD/SSD drives.
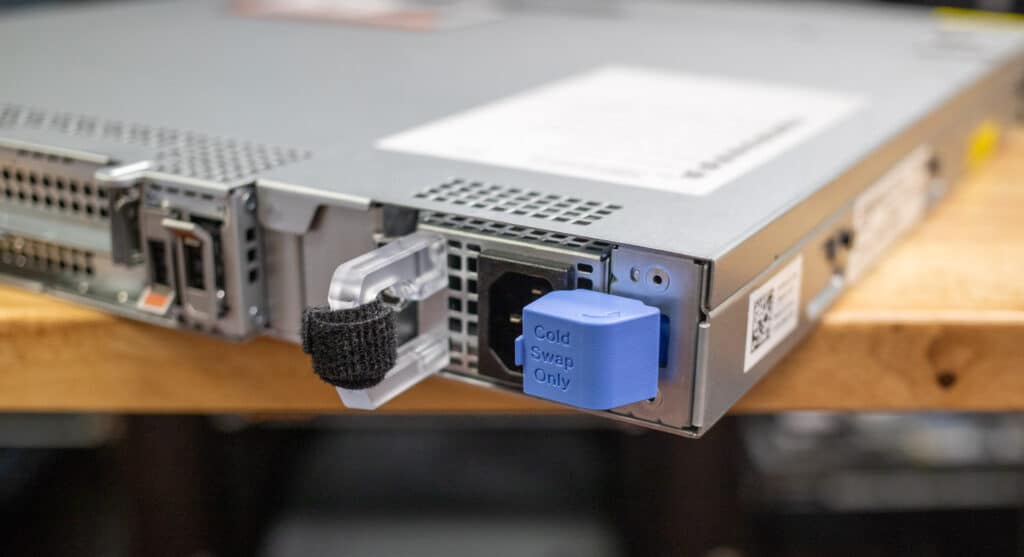
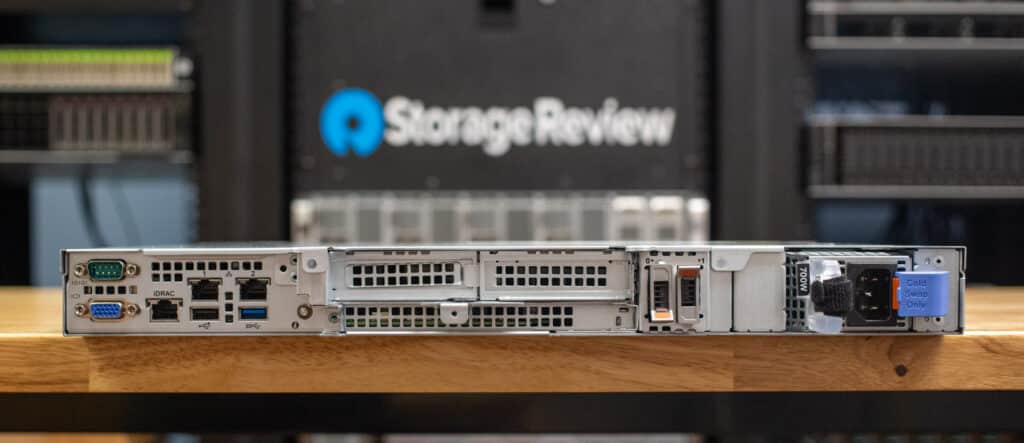
On the back of the server, you will see a single 450W Platinum or 700W Titanium-replaceable PSU, catering to different energy efficiency and performance needs. There is a “Cold Swap Only” tag on the PSU, but as there is only one power supply hopefully the IT admin doesn’t need this reminder.
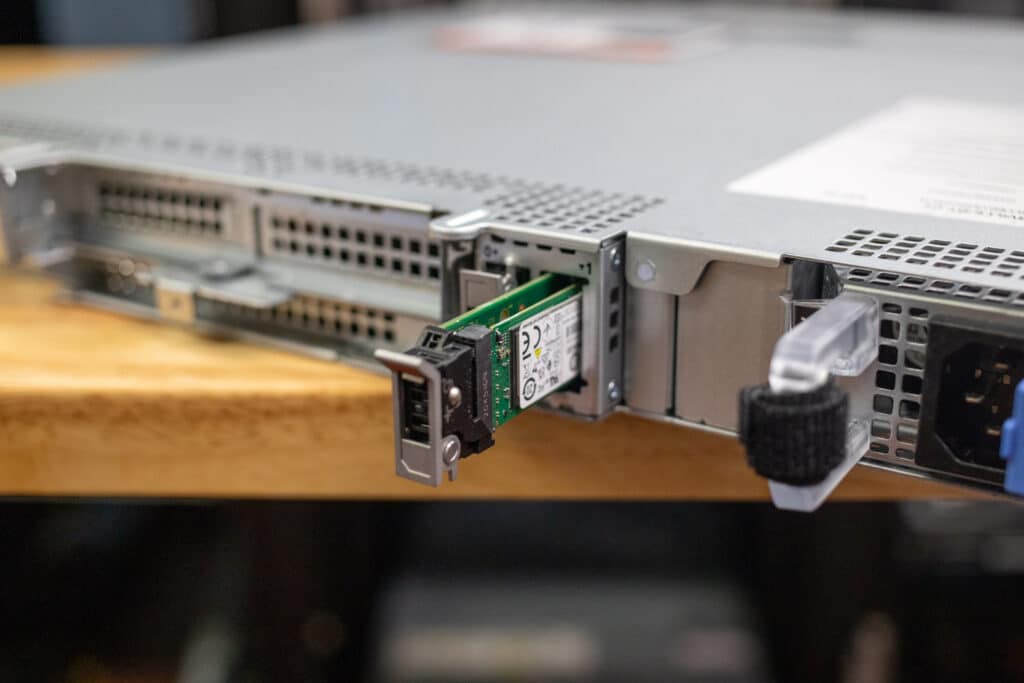
The R260 is equipped with a plug BOSS-N1 slot, which means it uses dedicated SSDs to handle the boot process, freeing up main storage for other tasks. This setup improves performance and provides storage redundancy for better reliability. The SSDs are externally accessible, making maintenance and replacements straightforward without opening the server chassis.
Also on the back panel is a variety of connectivity ports and slots. From left to right, it includes VGA/serial ports, an iDRAC port, two USB ports, two Ethernet ports, another set of two USB ports, a serial port, and expansion slots for additional network cards or other peripherals.
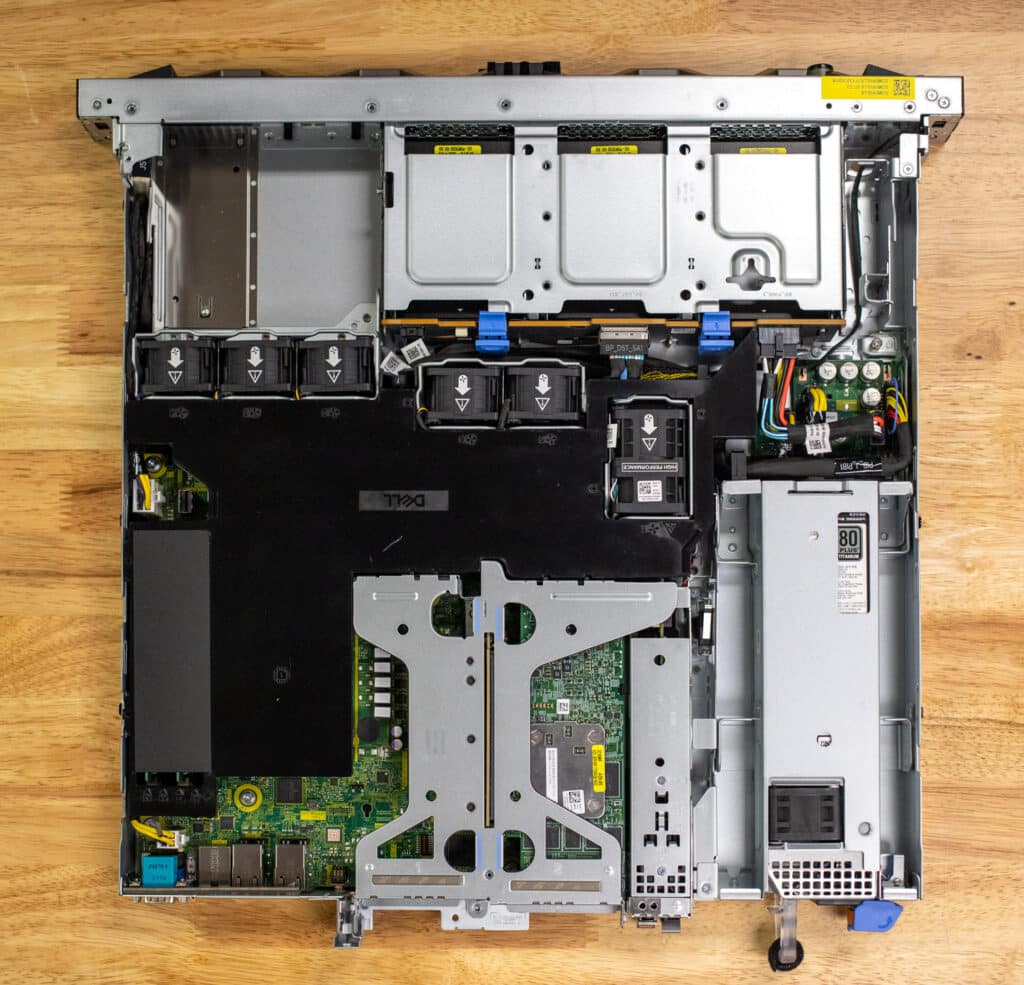
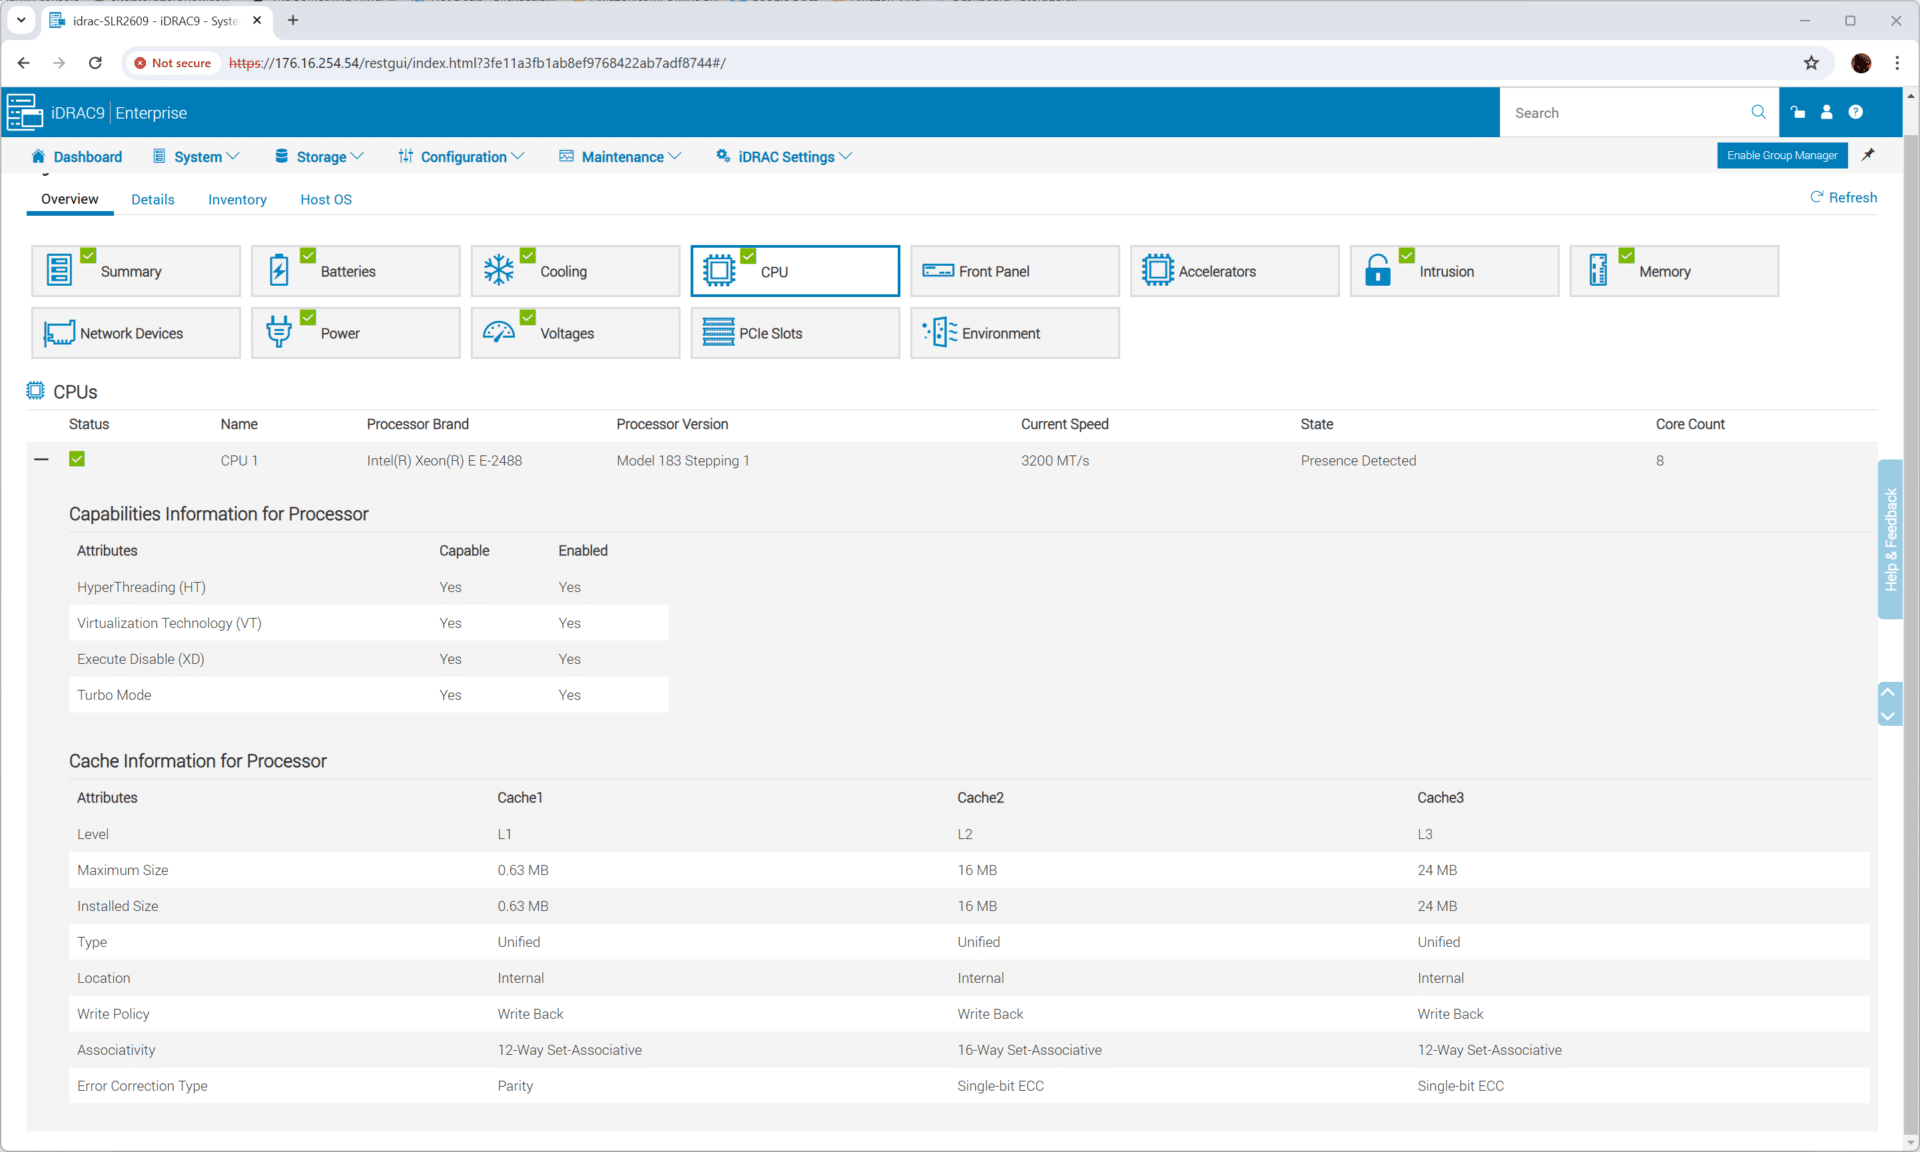
Under the hood, the R260 is powered by an Intel Xeon E-2400 processor, which offers improvements over its predecessors.
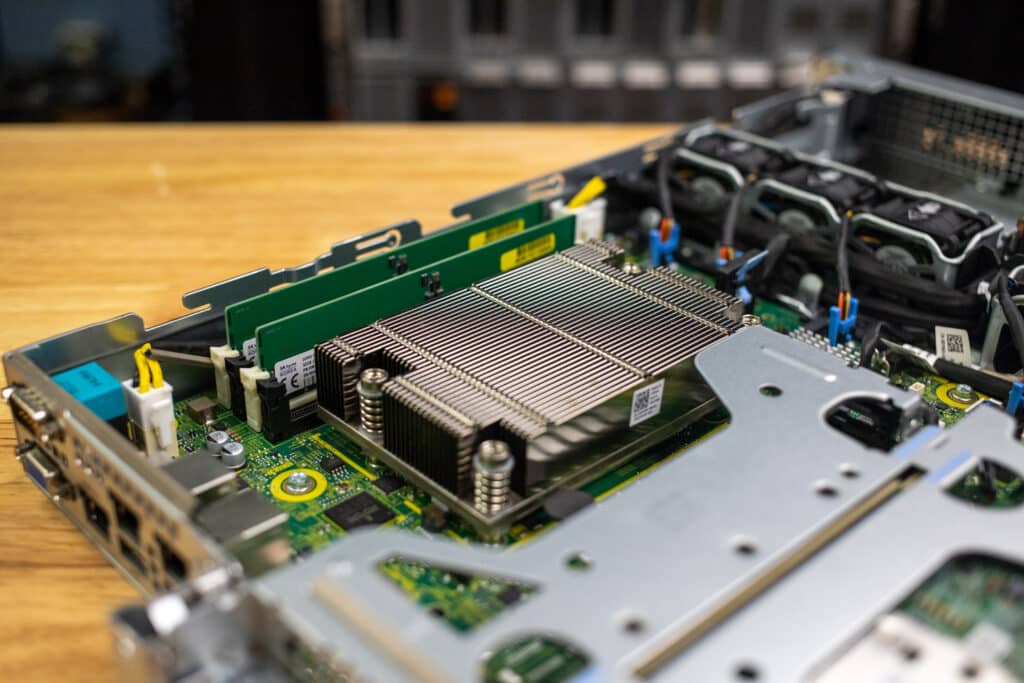
The server supports DDR5 memory with up to four UDDR5 slots, allowing a maximum of 128GB, which enhances its capability to handle edge applications.
Dell PowerEdge R260 Management and Maintenance
The PowerEdge R260 is managed using Dell’s integrated Dell Remote Access Controller (iDRAC). iDRAC provides comprehensive remote management capabilities, allowing administrators to monitor, update, and troubleshoot the server regardless of its physical location.
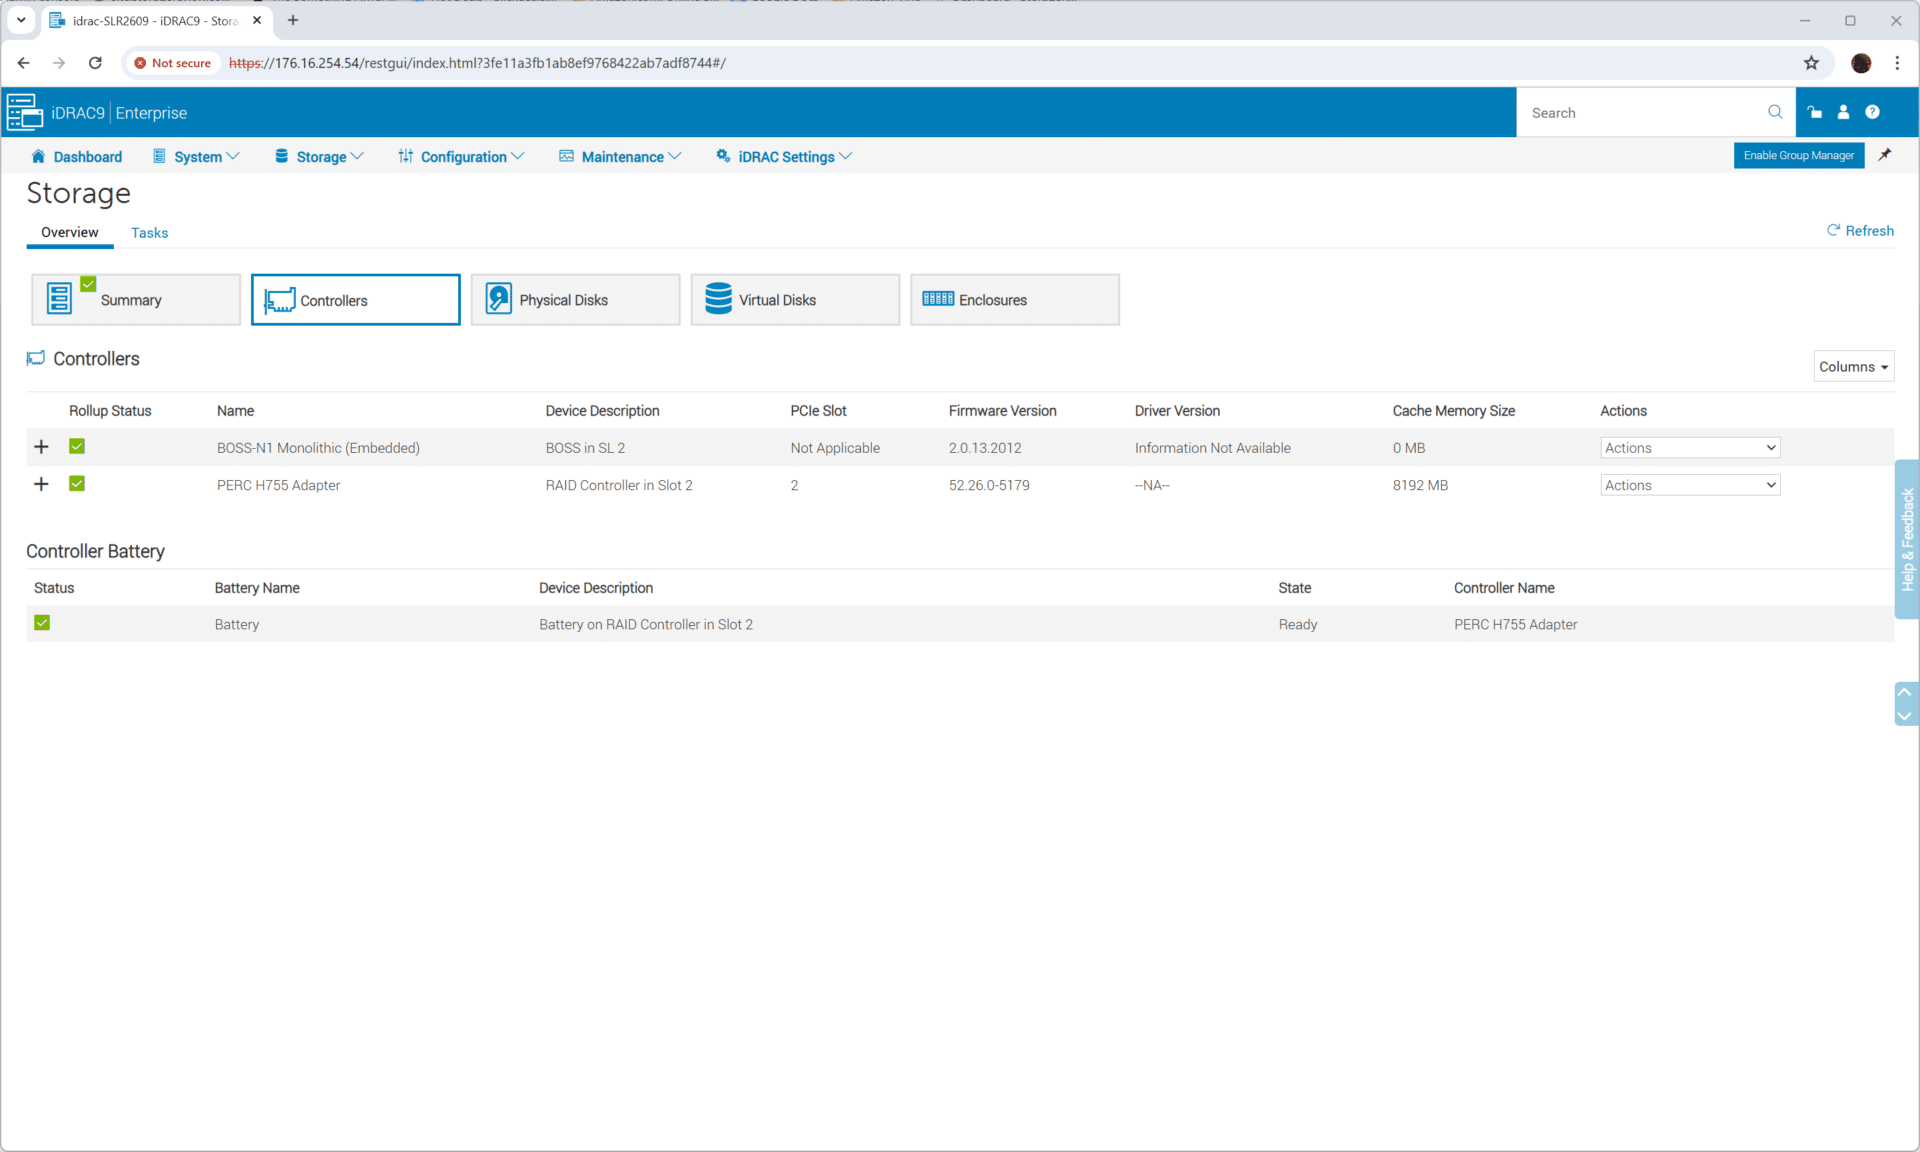
Key benefits include streamlined server deployment, increased operational efficiency, and enhanced security through features like system lockdown and drift detection, ensuring robust and reliable management of the server infrastructure.
Dell PowerEdge R260 Performance
To assess the true capabilities of the Dell PowerEdge R260, we put it through a series of rigorous performance tests, including Blender 4.0 for 3D rendering, Y-Cruncher for computational performance, Geekbench 6 for overall system benchmarking, Cinebench R23 for CPU rendering, 7-Zip for compression and decompression performance, and Blackmagic Disk Speed Test for storage read/write speeds. Additionally, we compared the results against the T160 tower form factor version.
These tests were designed to evaluate various aspects of server performance, including processing power, memory efficiency, and storage handling, under different workloads. By comparing the R260 with the T160, we aimed to highlight the strengths and potential areas of improvement of each model, providing a comprehensive overview of their performance in real-world scenarios. Both servers have the same CPU, although the R260 shipped with 64GB of RAM while the T160 included just 32GB.
Here is the build of our R260 server:
- Intel Xeon E-2488 (8c/16t) processor
- 64GB DDR5 RAM
- 1x 960GB BOSS SSD in RAID1
- 6 x Samsung PM883a
Blender 4.0 CPU
Blender 4.1 would not properly install on both the R260 and T160, however, we were able to get the previous version (4.0) to work. Blender OptiX–an open-source 3D modeling application. This benchmark was run using the Blender Benchmark CLI utility. The score is samples per minute, with higher being better.
In the Blender 4.0 benchmark results, the Dell R260 demonstrated superior performance compared to the T160, with higher scores in all tested scenes: Monster (99.64 vs. 80.51), Junkshop (66.65 vs. 56.20), and Classroom (51.19 vs. 40.85). The R260’s better performance is likely due to its advanced specifications, including a higher core count, faster clock speeds, and more efficient thermal management, enabling it to handle complex rendering tasks more effectively than the T160.
| Blender 4.0 CPU | R260 | T160 |
| Monster | 99.64 | 80.51 |
| Junkshop | 66.65 | 56.20 |
| Classroom | 51.19 | 40.85 |
Y-Cruncher 0.8.3
Y-Cruncher 0.8.3 benches a server’s performance by calculating large mathematical constants such as pi to extreme precision. It tests the server’s CPU and memory capabilities under heavy computational load, providing insights into its processing power and efficiency.
The performance differences between the two machines are intriguing as both feature the same CPU and 4400 MT/s RAM. The primary distinction is that the R260 has 64GB of DDR5 RAM while the T160 has 32GB of DDR5 RAM, which seems to provide Y Cruncher with additional overhead, enhancing performance in smaller tests. While using more RAM channels generally boosts Y Cruncher’s performance, both systems are limited to two DIMMs.
| Y Cruncher (Total Computation Time) |
R260 | T160 |
| 1 Billion | 35.118 Seconds | 42.303 Seconds |
| 2.5 Billion | 100.2 Seconds | 119.206 Seconds |
| 5 Billion | 220.128 Seconds | 263.0 Seconds |
Geekbench 6 CPU
Geekbench 6 is a cross-platform benchmark that measures overall system performance. However, comparing single-core vs. multi-core and the OpenCL benchmark would be interesting. Higher scores are better.
The performance benchmarks of the R260 and T160 using Geekbench 6 reveal notable differences. In the Single-Core Score, the R260 outperformed the T160 with a score of 2,747 compared to 2,483. Similarly, in the Multi-Core Score, the R260 achieved 14,384, surpassing the T160’s 13,132. Despite having identical CPUs and 4400 MT/s RAM, the R260’s 64GB of DDR5 RAM appears to provide it with a performance edge over the T160’s 32GB of DDR5 RAM in both single-core and multi-core tests
| Geekbench 6 CPU | R260 | T160 |
| Single-Core Score | 2,747 | 2,483 |
| Multi-Core Score | 14,384 | 13,132 |
Cinebench R23
Maxon’s Cinebench R23 is a CPU rendering benchmark that utilizes all CPU cores and threads. We ran it for both multi- and single-core tests. Higher scores are better.
Here, the results demonstrate a significant performance advantage for the R260 over the T160. In the CPU Multi-Core test, the R260 scored 16,056 compared to the T160’s 12,885. For the CPU Single-Core test, the R260 achieved 2,000, while the T160 scored 1,775. Additionally, the MP Ratio for the R260 was 8.03x, significantly higher than the T160’s 1.26x. These results suggest that the R260’s memory configuration contributed to its superior performance.
| Cinebench 2023 | R260 | T160 |
| CPU Multi-Core | 16,056 | 12,885 |
| CPU Single-Core | 2,000 | 1,775 |
| MP Ratio | 8.03x | 1.26x |
Cinebench 2024
Maxon’s Cinebench 2024 is a CPU and GPU rendering benchmark that utilizes all CPU cores and threads. We ran it for both multi- and single-core tests.
| Cinebench 2024 | R260 | T160 |
| CPU Multi-Core | 898 | 730 |
| CPU Single-Core | 117 | 104 |
| MP Ratio | 7.71x | 7.04x |
7-Zip
The popular 7-Zip utility has a built-in memory benchmark that demonstrates CPU performance.
Here, results show a slight performance edge for the R260 over the T160. During compression, the R260 achieved a current rating of 78.716 GIPS and a resulting rating of 78.809 GIPS, compared to the T160’s 70.194 GIPS and 70.353 GIPS respectively. In decompression, the R260 scored a current rating of 87.013 GIPS and a resulting rating of 85.517 GIPS, surpassing the T160’s 71.450 GIPS and 71.302 GIPS. Overall, the total rating for the R260 was 82.163 GIPS, while the T160 managed 70.692 GIPS.
| 7-Zip Compression Benchmark (Higher is better) | R260 | T160 |
| Compressing | ||
| Current CPU Usage | 1336% | 1376% |
| Current Rating/Usage | 5.892 GIPS | 5.101 GIPS |
| Current Rating | 78.716 GIPS | 70.194 GIPS |
| Resulting CPU Usage | 1342% | 1378% |
| Resulting Rating/Usage | 5.871 GIPS | 5.105 GIPS |
| Resulting Rating | 78.809 GIPS | 70.353 GIPS |
| Decompressing | ||
| Current CPU Usage | 1591% | 1588% |
| Current Rating/Usage | 5.470 GIPS | 4.499 GIPS |
| Current Rating | 87.013 GIPS | 71.450 GIPS |
| Resulting CPU Usage | 1569% | 1587% |
| Resulting Rating/Usage | 5.451 GIPS | 4.476 GIPS |
| Resulting Rating | 85.517 GIPS | 71.302 GIPS |
| Total Rating | ||
| Total CPU Usage | 1456% | 1482% |
| Total Rating/Usage | 5.661 GIPS | 4.791 GIPS |
| Total Rating | 82.163 GIPS | 70.692 GIPS |
Blackmagic Raw Speed Test
We have been running Blackmagic’s RAW speed test to stretch video playback. This is more of a hybrid test that includes CPU and GPU performance for real-world RAW decoding
| Blackmagic Raw Speedtest | R260 | T160 |
| CPU | 65 FPS | 54 FPS |
Blackmagic Disk Speed Test
The Blackmagic Disk Speed Test measures the read and write speeds of storage devices to evaluate their performance. In this test, the T160 outperformed the R260 in write speed, achieving 1,075 MB/s compared to the R260’s 904.8 MB/s. However, in read speed, the R260 slightly edged out the T160 with 2,704 MB/s versus 2,676.7 MB/s.
| Blackmagic Disk Speedtest | R260 | T160 |
| Write | 904.8 MB/s | 1,075 MB/s |
| Read | 2,704 MB/s | 2,676.7 MB/s |
UL Procyon AI Computer Vision Benchmark (Version 2.7.564)
UL Procyon AI Inference is designed to gauge a workstation’s performance in professional applications. It should be noted that this test does not take advantage of multiple CPU capabilities. Specifically, this tool benchmarks the workstation’s ability to handle AI-driven tasks and workflows, providing a detailed assessment of its efficiency and speed in processing complex AI algorithms and applications.
The results span a range of AI models, indicating the server’s versatility in handling different types of AI workloads.
The R260 demonstrated faster inference times across most models: MobileNet V3 (1.10 ms vs. 1.16 ms), ResNet 50 (14.90 ms vs. 16.58 ms), Inception V4 (44.42 ms vs. 48.31 ms), and YOLO V3 (117.50 ms vs. 126.69 ms). The T160 slightly outperformed in DeepLab V3 (45.65 ms vs. 46.80 ms). For REAL-ESRGAN, the R260 was faster (4617.61 ms vs. 4981.11 ms). Overall, the R260 scored 97, while the T160 scored 91.
| UL Procyon Average Inference Times | R260 | T160 |
| MobileNet V3 | 1.10 ms | 1.16 ms |
| ResNet 50 | 14.90 ms | 16.58 ms |
| Inception V4 | 44.42 ms | 48.31 ms |
| DeepLab V3 | 46.80 ms | 45.65 ms |
| YOLO V3 | 117.50 ms | 126.69 ms |
| REAL-ESRGAN | 4617.61 ms | 4981.11 ms |
| Overall Score | 97 | 91 |
Conclusion
The Dell PowerEdge R260 delivers a robust and efficient solution for small to medium-sized businesses in a compact, “pizza box” sized form factor. Its short-depth design makes it an ideal choice for space-constrained environments, small businesses, and edge deployments.
The R260’s Boot Optimized Storage Solution (BOSS) slot enhances performance and reliability by providing excellent redundant storage that is externally accessible and the server offers iDRAC for remote management. This, combined with its solid overall performance and starting price under $1,500, makes the R260 an efficient solution for various edge workloads that don’t need larger, more powerful, servers.
Engage with StorageReview
Newsletter | YouTube | Podcast iTunes/Spotify | Instagram | Twitter | TikTok | RSS Feed